I was recently considering implementing simple animation system with a vertex shader, when I remembered just what a pain debugging shaders can be... Implementing some kind of shader output can be difficult to do, time consuming and odds on you'll be testing in a way that means the shader isn't actually being used as it would be normally. Ideally I'd want something where the shader I'm debugging is running as close to a normal manner as possible.
This is problematic as usually shaders are designed to only output a few very specific pieces of information, directly into the render pipeline. Sure you can change the frag colour with some information, but detecting the difference between a few different shades of pale red can send you cross eyed and none the wiser.
Fortunately with GLSL 4.3 there are a few additional features that are ideal for logging values, this does mean that we're restricted to debugging on the desktop but its less of an issue than you'd think - even integrated graphics of nearly 5 years ago (Intel gen 8+) is all you need.
To see debugging in action, I'll start my making a copy of raylib's "default" shader
in vec2 vertexTexCoord;
in vec4 vertexColor;
out vec2 fragTexCoord;
out vec4 fragColor;
uniform mat4 mvp;

void main()
{
    fragTexCoord = vertexTexCoord;
    fragColor = vertexColor;
    gl_Position = mvp*vec4(vertexPosition, 1.0);
}
The vertex shader is very simple all its really doing is taking the colour and vertex information from a vertex buffer and translating the vertex coordinates into the view space (mvp is an abbreviation for Model View Perspective, its a combination of three different matrices - you could send the three separately to the shader and multiply, but then that's an expensive operation per vertex.)
The default shaders fragment shader is just as straight forward
in vec2 fragTexCoord;
in vec4 fragColor;
out vec4 finalColor;

uniform sampler2D texture0;
uniform vec4 colDiffuse;

void main()
{
    vec4 texelColor = texture(texture0, fragTexCoord);
    finalColor = texelColor*colDiffuse*fragColor;
}
Were taking colour from three different sources, the vertices (not that commonly used to be honest) The diffuse colour (an overall colour when seen in bright white light) and finally a colour value looked up from the texture coordinates that usually accompany each vertex.
The first "new" (to me!) feature that caught my eye was atomic counters, this is ideal for identifying how far through rendering you are. Each time a shader is executed a counter is incremented. This keeps track of just which vertex or fragment is being processed. As I understand it there would have been little difference using atomic operations on a specific type of buffer, but I chose to get the counters working first before looking at actually logging data.
Since OpenGL 4.3 there has been a special type of buffer called Shader Storage Buffer Objects (SSBO), these are ideal for logging data and probably many more uses as not only can GLSL read and write to SSBO's but so can your application. They can also be much larger than other types of shader buffers, the spec guarantees some 128MB of space and aparently many implementations will let you use as much GPU memory as is currently available... ( could maybe be useful for testing shaders under tight memory conditions )
I chose to limit things to any array of 1024 vec4's and the same sized arrays for a couple of id's to keep track of things. I'm also using a single id via atomic operations, to keep track of just where in the buffer the latest values should be stored.
There are some wrinkles with implementing this, so the shader needs a few helper functions, which are embedded in your target shader just before you compile it.
void UpdateFragCounter()
void UpdateVertCounter()
void LogValue(uint messageID, vec4 value)
There are two slightly different versions of LogValue depending if the fragment or vertex shader is being executed. Similarly UpdateFragCounter() is only available in the fragment shader. For convenience updating a counter also updates a copy the counter, this is intended to allow you to filter what you log, and writing to this variable (fragCounter or vertCounter) will do nothing but mess things up!
In order to log values we need to manually add a few LogValues to the target shader, a convenience function adds the support functions to the shader for you.
void main()
{
    fragTexCoord = vertexTexCoord;
    fragColor = vertexColor;
    gl_Position = mvp*vec4(vertexPosition, 1.0);

    UpdateVertCounter();
    if (vertCounter>=4 && vertCounter<=8) {
        LogValue(2, gl_Position);
        LogValue(1, vec4(vertexPosition, 0.0));
    }
    if (vertCounter==16) LogValue(2, gl_Position);
}
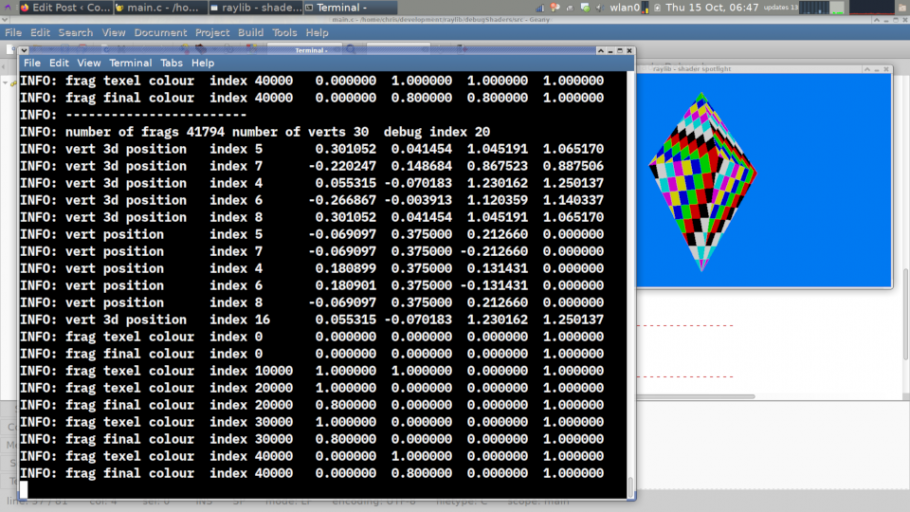
The first 5 lines of the main function is as before, the additions first update the vertex counter, which we then check, in this case we log a couple of values for vertex 4 to 8 and just one value when we get to vert 16. Rather than push a whole bunch repeated strings in the debug buffer, just an id is stored. When your application actually displays the debug information, you supply an array of strings this id is used to identify which string in the array to use.
char* dlabels[] = {"invalid","vert position","vert 3d position",
                   "frag texel colour","frag final colour"};
for vertices 4 to 8, we're logging a message id corresponding to "vert position" and "vert 3d position", while you can only log vec4 values this doesn't mean you can't stuff something like an integer into one of the vec4 members.
The fragment shader is little different although in the background some of the support code is slightly different.
void main()
{
    vec4 texelColor = texture(texture0, fragTexCoord);
    finalColor = texelColor*colDiffuse*fragColor;

    UpdateFragCounter();
    if (fragCounter / 10000.0 == fragCounter / 10000) {
        LogValue(3, texelColor);
        if (fragCounter != 10000) {
            LogValue(4, finalColor);
        }
    }
}
There are many more fragments than vertices so this time I'm only logging every 10,000ths iteration and just to show you don't have to log the same stuff each time I'm only logging one thing on fragment 10,000.
The application itself has, as previously mentioned a number of helper functions too.
void AddDebugShaderFunctions(char** vertShader, char** fragShader);
void SetUpShaderDebugBuffers(Shader shader);
void ResetDebugCounters();
void PrintShaderDebug(char** dlabels);
AddDebugShaderFunctions prepends helper functions and definitions to both of the target shaders.
SetUpShaderDebugBuffers sets up the debug buffers for access by our application.
You might choose to print the debug buffer just once a second, while printing the debug buffer will reset the debug buffer, if you're not printing the buffer you must call ResetDebugCounters as each frame you're still updating the buffer.
So the only thing left really is to see the whole thing in action together, so here is a complete ready to compile example...
Typically for all the head scratching now I look back at the code its actually not that complex (now its finished!!)
Oh I nearly forgot something of interest to try, now you know which fragment is rendering try changing the shade of the fragment depending on its index (id value) you will be able to see the order in which each part of a triangle is rendered, take the same code and run it on a different vendors GPU, its very likely you'll see the same triangle being rendered differently. Also of interest, if rendering a perfectly static scene on my hardware, each frame the fragments end up in a seemingly random order from frame to frame...
Enjoy!